News
Newest news stories are at the top.
Contents
- 19 Sept 2014: Final stakeholder workshop news
- 20 June 2013: Second field season
- 22 Oct 2012: News from Bristol!
- 15 Oct 2012: The first summer of fieldwork is complete
- 6 July 2012: Half way in the first field season
- 18 April 2012: Field work is underway!
Final stakeholder workshop news
Update: 19 September 2014
Having completed the second field season in September 2013, and spent much of the remainder of the project identifying insect specimens and collating and analysing data, we were finally ready to discuss some of initial results earlier this month. On Tuesday 2nd September 2014, we held our final project stakeholder workshop at the headquarters of FERA (Food and Environment Research Agency) in Sand Hutton, near York. The day was attended by delegates from a range of backgrounds, including landowners, conservationists, academics and stakeholders drawn from industry, government and beekeeping associations. The workshop was a chance for us to present some of the preliminary findings from the different aspects of our work directly to interested parties, but also to get some input back from delegates regarding what these findings mean for the different interest groups and how we should disseminate the final results to achieve maximum impact and usefulness. Overall, our results and discussions were well received by attendees, and we came away with some good ideas for moving forward with our final analyses and reports.
As promised, the slideshows presented at the workshop are here to download in pdf form - click on the title of each talk to download. Please note that the results presented within these slideshows are preliminary, are subject to change and should not be cited or published without the consent of the Agriland team..
- Prof. Simon Potts: Welcome and introduction - Threats to UK Insect Pollinators: Challenges for Research
- Prof. Bill Kunin: Introduction to the Agriland project
- Dr. Deepa Senapathi: Impact of historic land use change on shifts in pollinator communities
- Prof. Jane Memmott: Quantifying nectar resources from the flower to the national scale
- Dr Simon Smart: Site selection and dataset ground truthing
- Dr Mark Gillespie: The impact of the field campaign results
- Dr Nigel Boatman: Variation in resource provision in agri-environment scheme options for pollinators
- Prof. Bill Kunin: Concluding remarks
Also available to download here is the workshop leaflet which was distributed to delegates on the day.
Second field season - half way point
Update: 20 June 2013
It's been a long time since the last update, but lots has been happening on the AgriLand project. The autumn and winter of 2012/2013 was largely spent collating the reams of data we collected, identifying over 8000 insects collected in 2012 and surveying landowners about their management practices. We also presented the outline of the project at the British Ecological Society Annual Meeting in Birmingham in December and received a good response to the premise of the project. We have barely scratched the surface with the analysis of last year's data due to the sheer volume of information we collected, and almost as soon as the first field season ended, it seemed like we were already preparing for the second.
We're already half way through the second and final field season, with a brand new team of 12 field assistants - or 8 new field assistants and 4 that returned from last year to provide some invaluable local knowledge and experience. The cold start to the spring has played havoc with this year's data collection - there are so few bees around! However, in the last few weeks the weather has picked up all over the UK and we're starting to see more and more flying insects, so hopefully populations will start to pick up for the sake of our data, and for pollinator populations in general. Let's hope the good weather continues!
News from Bristol! Where the floral resource fieldwork has now been completed!
Update: 22 October 2012
Since the beginning of the AgriLand project in 2011, scientists at Bristol University have been working on an important source of data for the project. In order for us to assess the level of floral resources available to pollinators in different landscapes, we need to know how much nutrition different flower species provide. This data only exists for relatively few species in the world, let alone in the UK. The work at Bristol has therefore been focussed on developing an extensive database of nectar and pollen production of the most important wildflower species. Here is an update of their progress:
 "We have just finished our second season of fieldwork and have managed to survey a total of 170 species so far! The main goal of our study is to create the most complete database of floral resources. We aim to quantify the floral resources produced by the most common species in the UK in order to establish their nutritional value for pollinators.
"At the beginning of the study, we had a list of the top 200 most common flowering, insect-pollinated species in the UK. We strived to find as many of these species as was possible in two different locations. Some species were easily found around Bristol in parks, nature reserves, allotments…but some others required travelling further afield. For instance, we have very happy memories of trips to the Peak District to find the heathland specific Vaccinium myrtillus (Bilberry) and also the Brecon Beacons to find Erica tetralix (Cross-leaved Heath). For each species, we collected nectar and pollen from the flowers and estimated floral abundance.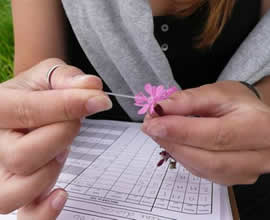
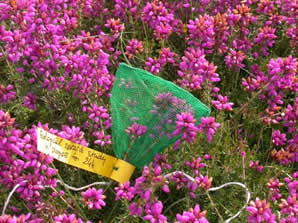
"Nectar, a rich sugary solution, is the main energetic resource for pollinating insects. We collected nectar from 10 flowers at each site after bagging them for 24h (pictured above) in order to allow their nectaries to replenish and exclude depletion by pollinators. Some species were easily sampled with microcapillaries (pictured right), but some others that produce very small amounts of nectar needed to be rinsed with distilled water. We calculated the volume of nectar produced and collected in the 24h period and measured the concentration of sugar using a refractometer. Our first results show a huge diversity in nectar quantity and quality among the species. To give you an idea of range, we found 0.8µg of sugars in one flower of Daisy and 8000µg in one flower of Himalayan Balsam!
"Pollen, primarily produced for plant pollination is also collected by insects to feed their brood and hence constitutes the main reproductive energy resource. We collected flowers in bud from the field and waited for dehiscence (flower opening) in the lab and collected full stamens. Subsequently, we aim to extract the pollen grains from the stamens, count 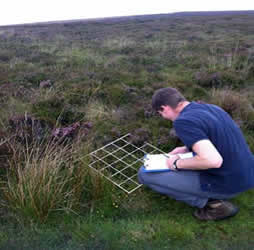 and measure their number and size under the microscope to estimate the volume of pollen produced per flower for each species. So, that’s a lot of lab work to be doing over the winter, followed by the first analysis results!
"Additionally, we counted floral abundance of all the species using quadrats (pictured left). This was to enable the process of ‘scaling up’ of the floral resources to more adaptable estimates to indicate the pollen and nectar resources available at vegetative and landscape scales (e.g. 1m2 of Daisies provides xµg). Our final database will allow us to rank the plant species according to their nutritional value for pollinators. By using our database to characterize the AgriLand field sites in terms of quantity of floral resources available to pollinators, we hope to provide vital information regarding the role of floral resources in the decline of pollinators!"
Mathilde Baude, Nancy Davies & Jane Memmott, with thanks to Vanda Miravent and Yves Daro for their grateful help in the field and on the lab!
The first summer of fieldwork is complete!
Update: 15 October 2012
It's been a long hard slog, but we have finally finished 6 months of surveys and packed up all our equipment for the winter. The summer has been a resounding success for the project despite the poor weather, as the field assistants managed to squeeze in 3 rounds of surveys of both insect pollinators and wildflowers on the project's 96 field sites. These data will give us a picture of the floral resources available to pollinators throughout the summer and an idea of the abundance of different pollinator species, in a range of habitats and land use types. Over the winter we can start crunching the numbers to see if we can find a relationship between the number and diversity of pollinators and the number and diversity of wildflowers.
We also have important information about the extent of different habitats and land uses on our field sites, and the abundance of useful landscape structures like hedgerows, fencelines and water courses. We can now start to examine links between this information and the pollinator and wildflower data, to identify the most important habitats, land use types and landscape structures for their survival.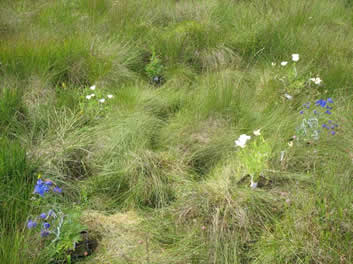
In addition to this data and the information from our solitary bee tube nests (see below), we also conducted a study into the "pollination service" on our field sites, or in other words the effectiveness of local insects at pollinating flowers. On each site, arrays of non-native plants (California poppies and Delphinium "Blue Pygmy", pictured) were placed and left for two weeks, after removing any flowers and ensuring there were some healthy flower buds ready to open on each plant. Within those two weeks, the flower buds were given a chance to open and be exposed to local pollinators, which hopfully moved between the individual plants pollinating the flowers. The plants were then collected in and once the fruits were ripe, they were bagged and returned to the lab where the seeds will be counted and weighed. The plants that produce abundant and heavy seeds are assumed to be those that were pollinated the best. The sites with the most well pollinated plants are then seen as having a high level of pollination service and, in theory, a healthy pollinator population. By linking this information back to the data on habitats and land uses, we can identify the types of landscapes that provide the best pollination service.
Watch this space for the results of this experiment, and all our other activities, as they come in!
Half way in the first field season
Update 6 July 2012
Despite the terrible weather this year, we're still plugging away on our fieldsites and have passed the half way stage in our first year of data collection! Already we're seeing broad differences in vegetation types and numbers and species of flowering plants between regions, and between the north and south of the country. Similarly, our traps have caught a lot more pollinators in the milder southern parts of the country, than in the nortern regions. 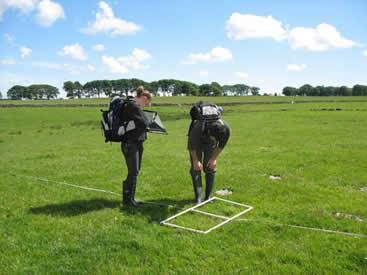
As its halfway, we have nearly completed 2 rounds of floral surveys and pollinator surveys, and before we complete our 3rd and final round we will be pausing to conduct our Phytometer experiment. "Phytometer" is a fancy word for a potted plant (phyto = plant, meter = to measure), and in this experiment we will place a number of potted plants of Californian poppy and Delphinium Blue Pygmy in the middle of the field sites to measure pollination services.
These plant species have been selected as they are not common in the surrounding landscapes, depend on insects for pollination and are unpalatable to livestock and rabbits! When the plants are placed out on the sites, any flowers will be pinched off, leaving only new buds. During the two weeks of the experiment, these buds will flower and hopefully attract insect pollinators which will pass between the individual plants and pollinate them. As our plants are the only individuals of these species in the landscape, we can be fairly certain that any pollination has occurred through insect visiting these plants.
After 2 weeks, we will collect the plants in and collect the resulting seeds. The weight and number of these seeds will give us an idea of the efficiency of pollinators on each site. Plants placed on a site with a low number of pollinators are less likely to have a large number of heavy seeds, than those placed on sites with healthy pollinator populations. That's the plan anyway. Watch this space to see if it works!
Field work is underway!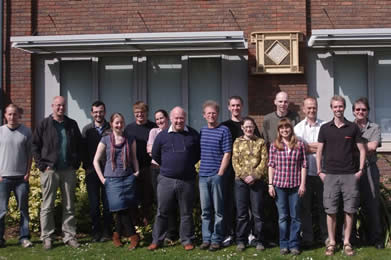
Update 18 April 2012
The field season is underway now with the project's 12 field assistants hard at work in our six focal regions of the country. They started work at the end of March with a few days of training at the University of Reading (right). From there, they emerged into the sun, sleet, snow, rain and wind to begin meeting the landowners and managers of their local sites and erecting tube nests for solitary bees or "bee hotels" (below).
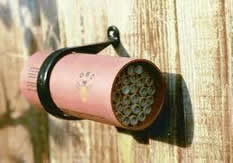
We use two types of nest - an arrary with different sized tubes to accomodate a range of different native solitary bees, and an array specifically designed for the red mason bee (Osmia rufa) (left). Both types of nest are placed out on each site, the latter with cocoons of males and females of O. rufa. Once mated, the females collect pollen from the local environment, form it into "bee bread" using nectar secretions and place it one of the tubes. An egg is then laid on the bee bread before the female seals the "cell" with mud and repeats the process until the tube is full.
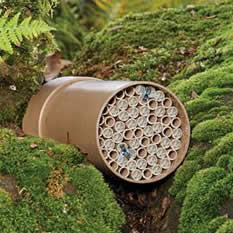
The rate at which the nests are filled with pollen and larvae give us a measure of the forage resources available at a site. The tubes are more likely to be filled quickly on a flower rich site than on a resource poor one. Later in the year, we can also identify to species the pollen grains inside the nests to find out which flower species the bees are using. The nests may even store important information on the natural enemies of the bees.
Bee hotels are available commercially for gardens and other areas (there's one on the wall in the top photo at Reading University), and are a great way to help native pollinators. Our bee hotels are supplied by The Red Beehive Company (www.redbeehive.com).